SAP 를 사용하면서 성능 분석 이슈가 발생하였을 때 확인 할 수 있는 대표적인 TCODE들을 정리해보았습니다.
Cockpit이 설치되어 있다면 cockpit을 통한 성능 분석이 가능하고 cockpit이 없을 경우에는 아래와 같은 대표적인 TCODE들을 통한 선능 분석 및 모니터링이 가능합니다.
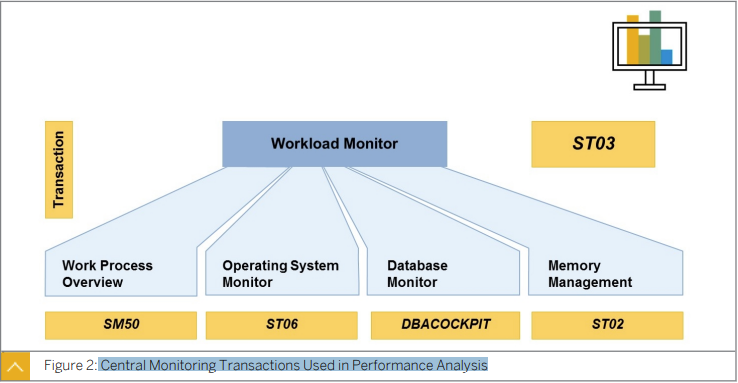
ST03 -> is the workload monitor of all application servers of the SAP system. Here you can see response times and response time components.
workload를 분석하는데 가장 중요한 TCODE, 응답 시간 및 응답 시간 구성 요소를 볼 수 있습니다.
통계 자료를 볼 수 도 있기 때문에 성능 문제에 대한 가장 중요한 모니터일 것입니다.
SM50 -> Transaction SM50 shows work processes of the application server you are logged on to and also offers a global view of all work processes in the SAP system - as of SAP_BASIS 740
SAP 시스템에서 대부분의 작업은 작업 프로세스의 의해 실행되기 때문에 작업 프로세스 모니터링 에 필요합니다.
ST06 -> Using transaction ST06 you can monitor the operating system of the host that the application server runs on. CPU utilization, memory allocation, and swap/page activity are the most important properties to look at. Operating system data is collected by the operating system program SAPOSCOL which has been integrated into SAP Host Agent.
SM04-> Transaction SM04 offers a column displaying the memory usage per user session.
사용자 세션당 메모리
ST02Transaction ST02 shows the buffer setup of the application server you are currently working on
Workload Distribution
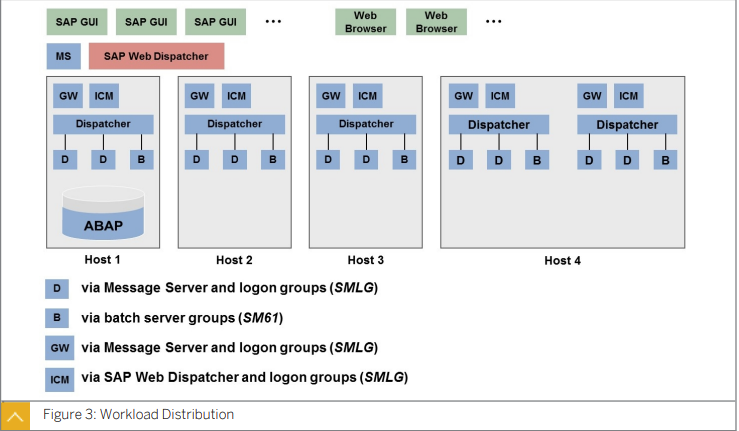
SMLG로 사용자가 정의해놓은 그룹에 따라 Distribution되고 MS(Message Server)에서 AP로 다시 Distribution되어 workload 를 분배합니다.
'SAP > SAPBC' 카테고리의 다른 글
| [SAP] Client copy SCCL (0) | 2022.06.29 |
|---|---|
| [SAP] S/4HANA Language import 언어팩 설정하기 (0) | 2022.06.29 |
| Exploring RFC Basics (2) | 2022.06.17 |
| [sap] 월별 DISK/MEMORY 사용량 통계데이터 TCODE ST04 (0) | 2022.06.08 |
| Analyzing Hardware Bottlenecks, 하드웨어 병목 현상 발생 (0) | 2022.06.07 |